Explore
your data.
Self-hosted analytics.
Bring your logs, metrics, and business data together. Query them, build dashboards, and set alerts on infrastructure you control.
Community is free: one node, all features, your storage.
Bring it in.
Start asking questions.
From a sensor reading to a server log, bring your data into one place and query across it. Go from incoming records to charts and answers in seconds.
Machines & servers
CPU, memory, processes, logs
Logship agentIoT & sensors
Readings, device events, telemetry
MQTT → agentApplications & services
Business events, logs, integrations
JSON over HTTPFiles & datasets
Exports, research, public records
CSV / TSV → CLIlogship
Your self-hosted
analytical database
Query. Understand.
Act.
Explore with queries.
Follow with dashboards.
Respond with
alerts.
Choose a source above for setup instructions. Each path writes to your Logship account; queries can join and aggregate across its tables.
What would you like to explore?
Start with a dataset, a machine, or the equipment already running at home.
Analyze a dataset
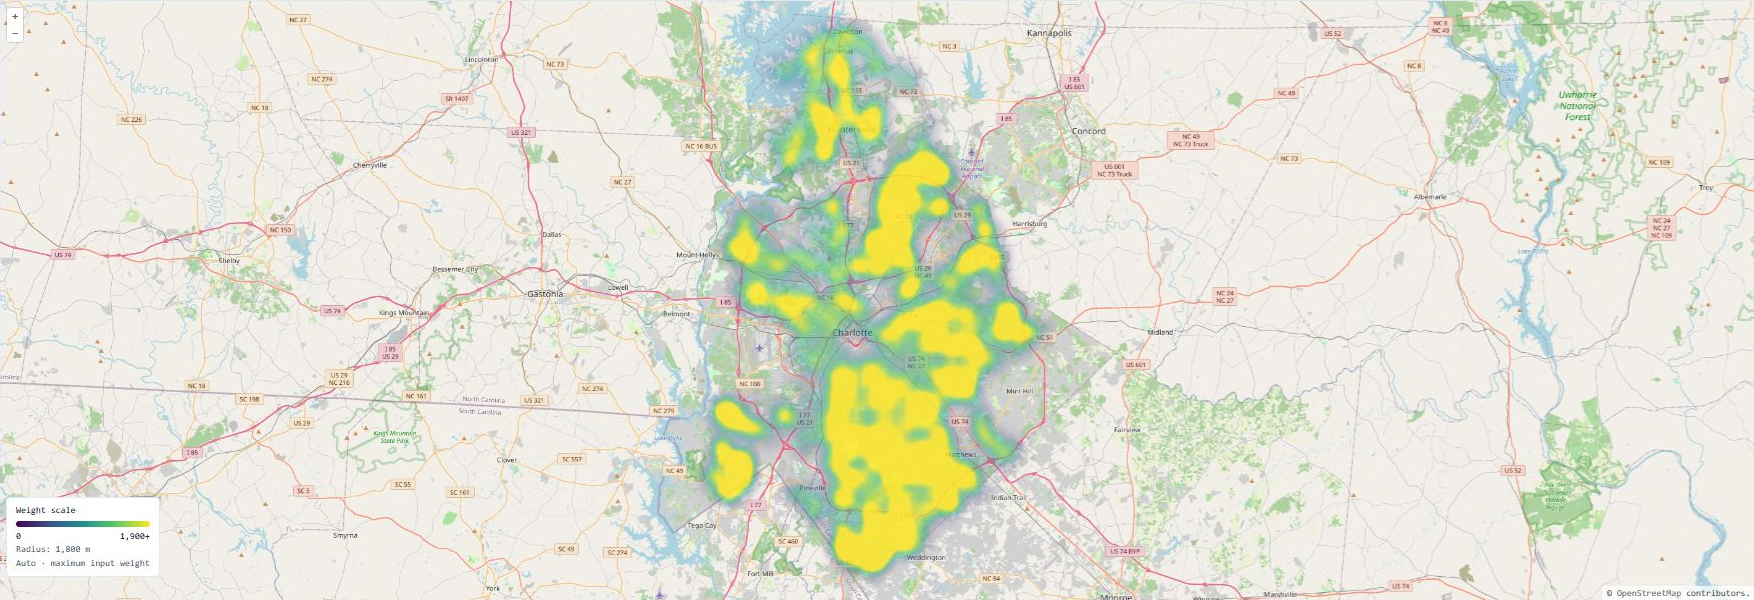
Upload files, connect sources, join records, and explore the results on a chart or map.
Monitor your machines
Collect system and network telemetry with the Logship agent. Investigate activity and changes over time.
Get to know your homelab
Watch SSH logins, follow Plex activity, and see what’s happening on your OpenWrt router.
Keep analytics on your infrastructure
Run locally, in your cloud, or on an isolated network. Your data stays in the deployment you control.
What changed
on your machines?
Follow CPU load across your hosts, then search the logs for the same time window. Save the queries to a dashboard. Set an alert for the conditions that need your attention.
Set up machine monitoring →- Metrics from the machines you run.
- Collect CPU, memory, disk, process, and network telemetry with the Logship agent. Compare hosts over time and investigate the process behind a spike.
- The logs that explain what happened.
- Search application log files, Linux journals, and syslog. Filter by machine, service, or message, and chart recurring events with the same query language.
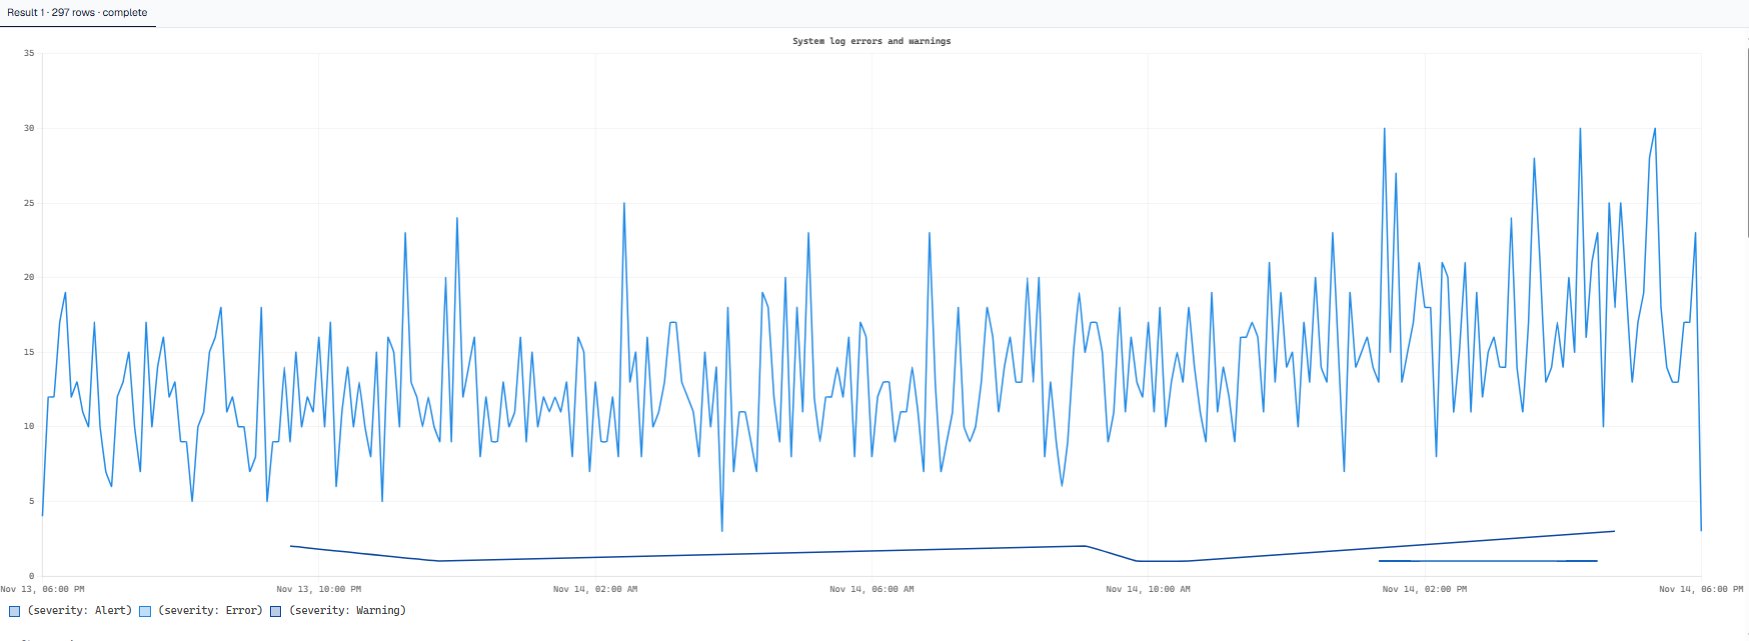
System log errors and warnings, counted in five-minute intervals.
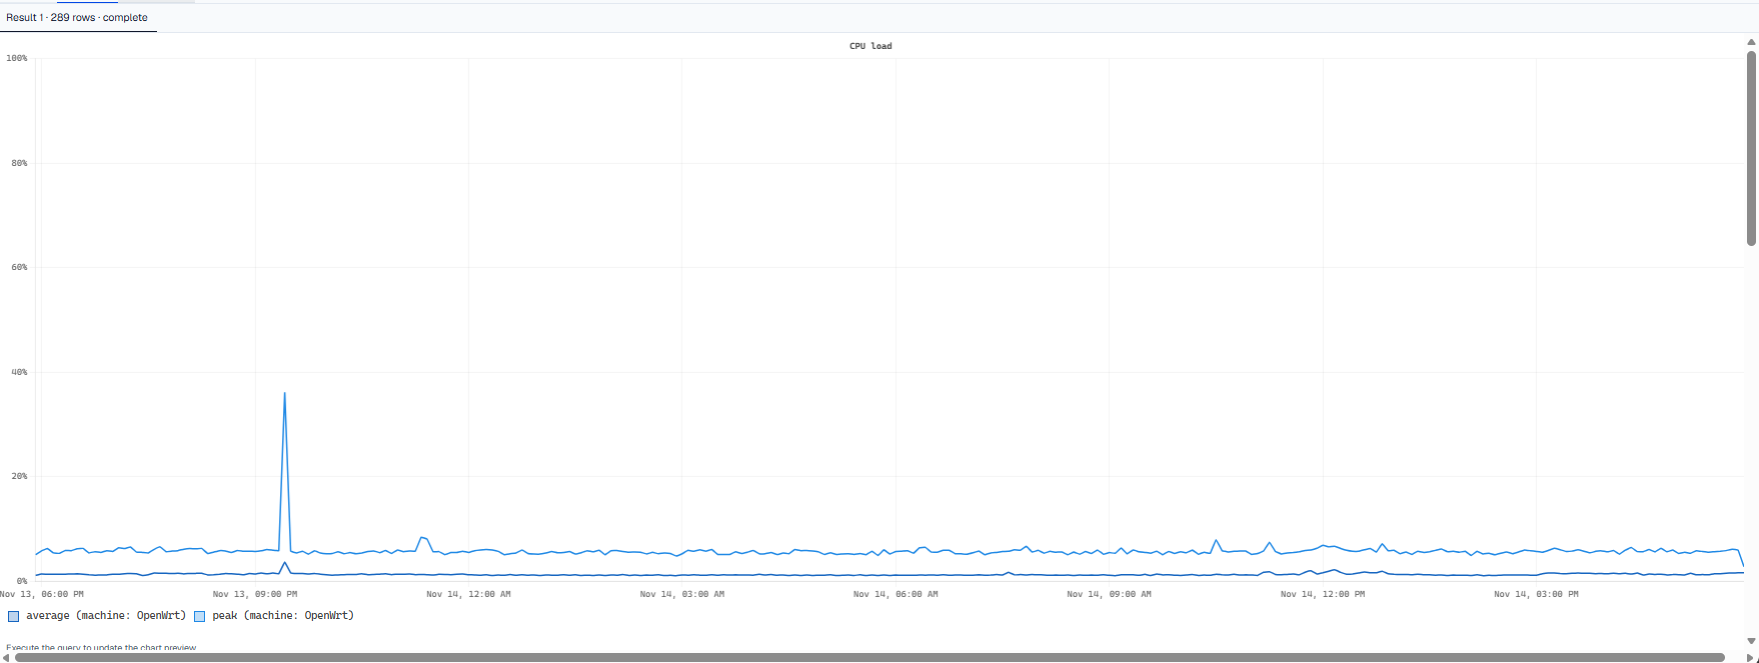
Average and peak CPU usage on an OpenWrt router over 24 hours.
Your servers.
Your Logship.
The Community edition is free for a single-node deployment. Use a machine you already have, a server at your business, or an instance in your cloud account.
Storage and query execution stay in your deployment, including on isolated networks. For an air-gapped installation, bring the installation artifacts and required services into your network.
Deployment options →Start free. Add capacity when you need it.
All features are included in every tier. You provide the infrastructure and storage.
| Edition | Price | Deployment | Support | Get started |
|---|---|---|---|---|
| Community | FreeForever | 1 nodeUnlimited storage | Community | Install free → |
| Business | $1,500 / monthSave 20% with annual billing | Up to 3 nodesScale upgrades available | Premium | Contact sales → |
| Enterprise | Custom pricing | Custom node count | Enterprise | Discuss deployment → |
Start exploring.
Explore the demo, or install the free Community edition on your own machine.
Have a deployment in mind? Talk to the team.