Experimental Render Timeseries Plots Supported!
By Peter Sulucz
Experimental timeseries plot rendering is now available in the UI!
This unlocked the render operation, which is available as the last expression in a query.
table_name
| render <chart-type>
Support is still limited, and only the "timechart" option is available. We plan to expand this, and enable more configuration options (axis names, grouping, etc)
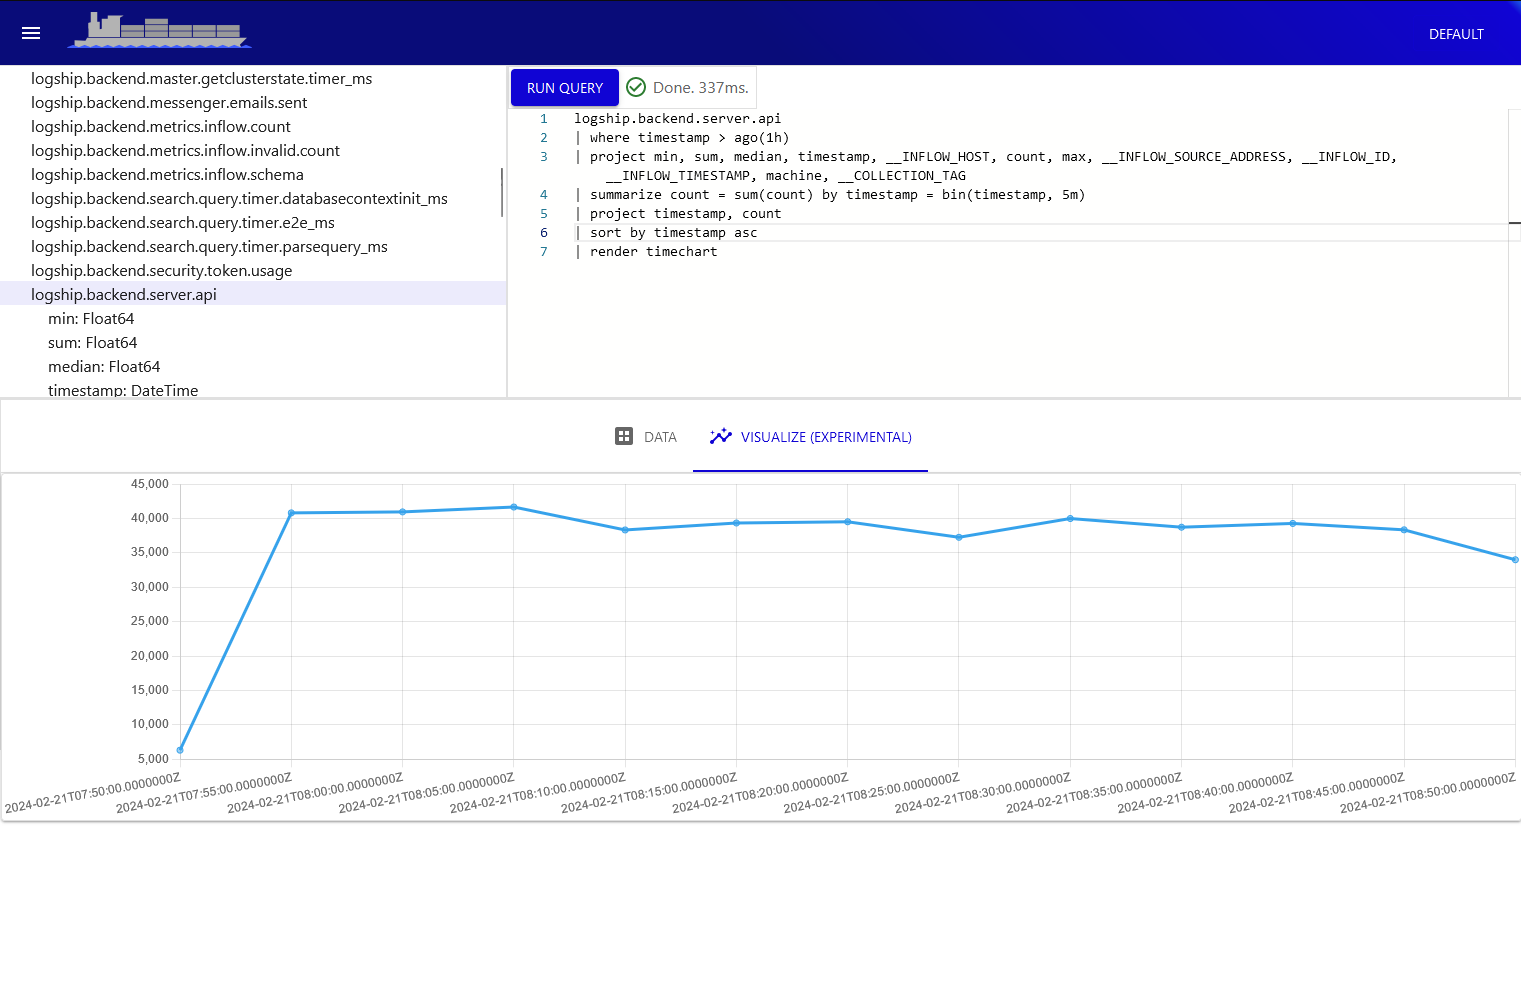
logship.backend.server.api
| where timestamp > ago(1h)
| summarize count = sum(count) by timestamp = bin(timestamp, 5m)
| project timestamp, count
| sort by timestamp asc
| render timechart
A quick demo is available below

Enjoy! Feedback welcome.
❤️ The logship team.